The Eviction Lab aims to better understand the causes and consequences of eviction in the United States. To do so, we have compiled court records from across the country into a national database. These court records provide a unique opportunity to examine the prevalence of eviction across time and space. But these records contain limited information about each case: case numbers, names of plaintiffs (e.g., landlords, property managers) and defendants (tenants), defendant addresses, filing dates, and case outcomes. Defendant gender and race/ethnicity are not included in eviction records.
Documenting populations disproportionately at risk of eviction informs researchers, advocates, and policymakers striving to better understand and address long-standing disparities in access to stable housing. The lack of data on defendant gender, race, and ethnicity limit our ability to address some of the most pressing questions in the field. Are Black and Latinx renters evicted at higher rates than their white counterparts? Are women renters evicted at higher rates than men? Is this true for all racial and ethnic groups? Answering these questions is central to addressing the long history of excluding women and communities of color from housing, banking, and credit opportunities in the U.S.
In a new study published in Sociological Science, we develop strategies to overcome limitations in the data and begin to answer these questions. Despite progress the U.S. made in legislating the Fair Housing Act and Equal Credit Opportunity Act, which banned discrimination by race, gender, and marital status, we found that property owners disproportionately threaten Black and Latinx renters—particularly women—with eviction.
In the study, we used a set of statistical techniques to impute—to predict based on available information—the gender and race/ethnicity of individuals facing eviction on the basis of names and addresses. The intuition is straightforward: Joseph Smith living in the predominantly-white Lincoln Park neighborhood of Chicago is likely to be a man and white, while Maura Smitts in the majority-Black Bronzeville neighborhood is likely to be a woman and Black.1 Given Census and Social Security data about the distribution of names by gender and race/ethnicity, we assigned every defendant in our data a probability of being a member of a given gender-by-race/ethnicity category.2 We used these probabilities to produce annual estimates of the number of individuals filed against and evicted in each group within each included county.
These absolute numbers are important, but the data are often more informative when presented as rates. Producing eviction rates allows researchers to compare the prevalence of eviction across counties of different sizes or racial composition. Because there are no established counts of the number of adult renters in each county by gender and race/ethnicity, we developed a new technique to estimate these numbers. In the hopes of inspiring further analysis, we are making all data used in this paper—as well as code to replicate our work—publicly available here:
Download the data and codeWith these data in hand, we calculated three statistics for every gender-by-race/ethnicity category:
Our analysis yielded three major findings.
First, filing and eviction rates were, on average, significantly higher for Black renters than for white renters. The share of eviction filings and eviction judgments against Black renters was considerably higher than their share of the renter population (see Figure 1).
This resulted in a striking racial disparity. There were just under 40 Black renters for every 100 white renters in these counties. Yet for every 100 eviction filings to white renters, we estimated that there were nearly 80 eviction filings to Black renters.
Use the search bar to select from 1,195 counties in our dataset. If a county does not appear in the dropdown list, its eviction demographics data is unavailable.
The average renter faced a 4.1% eviction filing rate, and an eviction rate of 2.3%. Put another way, approximately one in 25 renters was threatened with eviction every year, and one in 40 was evicted. These rates varied considerably by race/ethnicity.
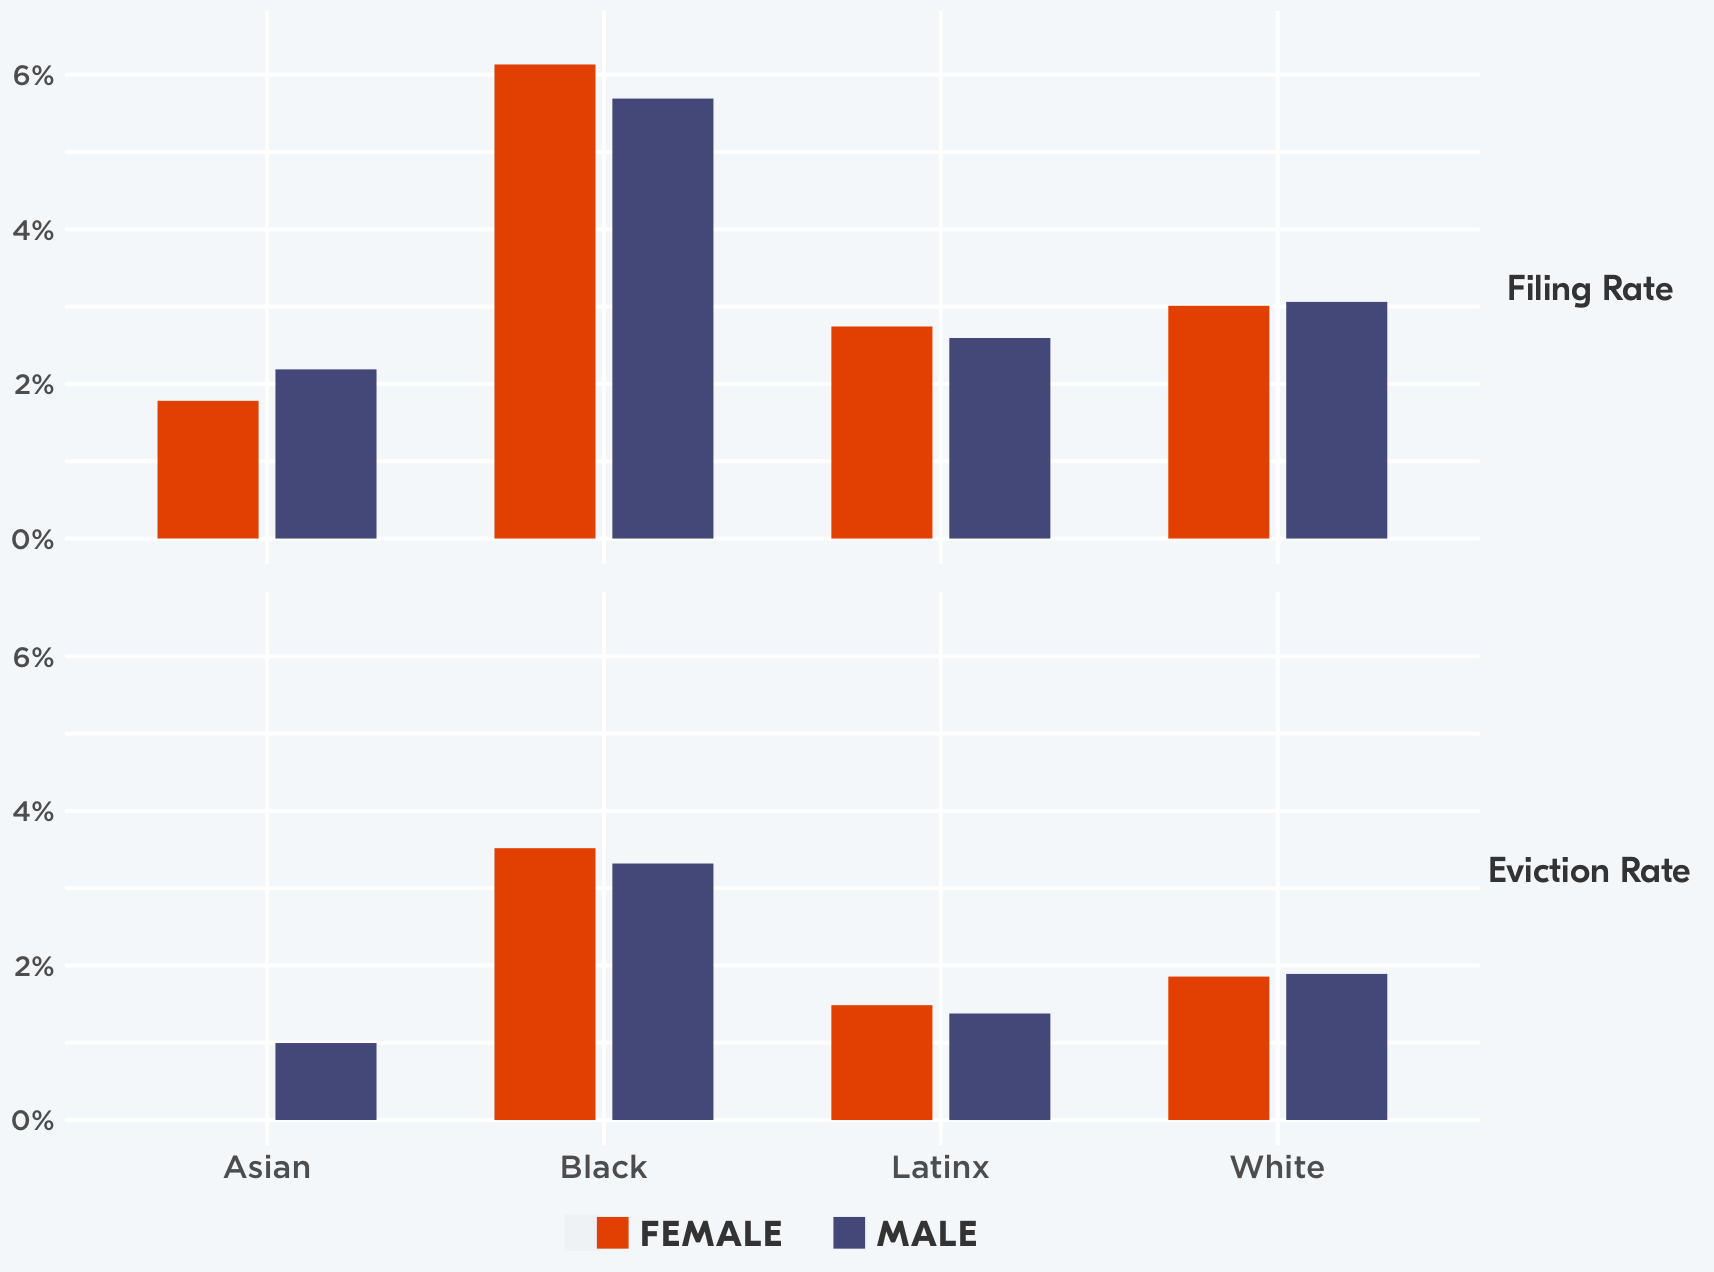
These patterns are reflected in Figure 2, which displays the distributions of filing rates (top panel) and eviction rates (bottom panel) for female and male renters by race/ethnicity.

Second, among renters, women—especially Black and Latinx women—faced higher eviction rates than men. Across all renters, the risk of eviction was approximately 2% higher for women than for men. Among Black renters this increases to 4%, and for Latinx renters it jumps to 9%.
These differences—the gaps that we see between the male and female rates in the bottom panel of Figure 2—may appear small, but they translate into thousands more women than men evicted each year. Across the 1,195 counties in our sample, we predicted that 341,756 women were evicted annually, approximately 16% more than the 294,908 evicted men.
Third, Black and Latinx renters who were filed against for eviction were most likely to be repeatedly filed against at the same address. The average Black renter experienced a serial eviction filing rate of 14.7%. Put another way, one in every seven Black renters who was filed against for eviction was repeatedly filed against at the same address. The equivalent average rates were 13.1% for Latinx renters, 11.2% for Asian renters, and 9.7% for white renters.
This study finds that Black and Latinx renters in general, and women in particular, are disproportionately threatened with eviction and disproportionately evicted from their homes. Black, Latinx, and women renters are thus disproportionately exposed to the many documented negative consequences of eviction, from homelessness and material hardship to job loss and depression. Eviction is not only a consequence of poverty, but also a cause. The large racial disparities in eviction rates documented here likely contribute to U.S. racial and gender inequalities in economic, social, and health outcomes. This paper provides new evidence of the extent to which people of color—especially women of color—are systematically excluded from housing stability that could allow them and their families to flourish in society.